join the mailing list
* indicates required

Friday, December 4, 2009

Gold Correction Underway?

At the risk of sounding like a broken record, we may finally be seeing the gold market have a healthy correction here.  In brief, assets have a tendency to return to their short term, intermediate term, and long term mean trend.  Although our intermediate term forecast for gold is at least 1300, running into spring of next year, that journey should be made up of smaller rises and consolidations.  A trip too quickly to 1300 implies either some euphoric buying without fundamental support that is unsustainable (sometimes called a blow-off top, a melt up, or a parabolic move) or, in this case, a dollar crash.  While the latter is absolutely possible, as we've discussed before, we don't believe we're quite there yet (just in case, that's the reason one should own some physical gold as insurance).  That leaves the former condition--simply put, we believe that gold has "gotten a bit ahead of itself."

Any correction in gold should be taken as good news for those bullish on the yellow, barbarous relic.  It's quite clear that the bull market has years--by our estimates, upwards of a decade--left to go.  Thus, consolidations represent good buying opportunities and can provide both traders and long term investors with good accumulation points that have a high reward/risk ratio.

Let's take a quick look at gold's action, some likely points of consolidation, and signals that could be used to make short and intermediate term decisions.  [Quick Aside: Our gold report, which is being written now, outlines the information presented here in greater detail.  We're working on getting it out the door now, but it's slowly but surely rivaling War and Peace in length...]

First, as always, the dollar....


As has been the case for a while, the slow stochastic has shown the dollar to be oversold.  Momentum is negative, but at a decision point where it could turn, and the RSI could go either way.  The dollar broke down through a triangle but has quickly rallied today, appearing to be thwarted at the 50 dma (the blue rectangle is our attempt to show what we believe today's dollar trading range will look like in advance).  We consider this a "false breakdown" which will likely be short lived before the downtrend is resumed.  Of course, a breach through the 50 dma that "sticks," meaning there's a clear penetration that holds at least overnight, will be a warning that something else could be in the works.  Note that the weekly and monthly charts do not show the dollar as oversold--yet.  That would be the catalyst for a larger rally.  We just don't believe that's quite in the cards until the spring.  The upcoming gold report, available by request only, has more detail on this condition.

So, why the dollar run up now?  What's the implication on the gold price?  Since the USDX is a basket of currencies, we have to look at the major components that move it, namely the euro and the yen.


Though it broke out last week, the euro has been tentative about moving further over the last 3 trading days.  Today, as noted by the large, red candlestick with the yellow highlighting (meaning that it is an intraday candlestick that is not yet final), the key support level around 150 (150.47, or 1.5047 in real currency terms, to be exact) gave way, implying a false breakout to the upside.  With the euro representing 57.6% of the USDX, obviously this has the most impact on a strengthening dollar.  The slow stochastic and MACD show it could move lower.  The key will be watching the RSI.  Note the red trendline since July just below 50.  There's not much downside room for the euro here.  We would expect a testing of the RSI trendline, which corresponds with a testing of the blue uptrend line which is tracking the 50 dma.  That will not take long to accomplish.  If the retest is successful (meaning it turns back up after it tests the blue trendline), then we will probably see a real, lasting breakout, especially if the slow stochastic is closer to 20 than 80 when the breakout occurs.  From a fundamental perspective, yesterday we saw dovishness from the European Central Bank (ECB) along with considerable jawboning down of the euro and support for the Fed.  It's a talking game, but it can work.  You can watch the replay of the press briefing at http://www.ecb.int/home/html/index.en.html.

Similarly, the intraday, 1 minute chart of the dollar against the yen shows a similar story.


The six month daily chart shows the yen's strongly overbought condition on the RSI and likely support region.  There's still some downside as the move that began around 5 days ago is probably only halfway done.


With both the yen, from an overbought condition, and the euro, from ECB jawboning, moving down against the dollar, this dollar move is not unexpected.  However, in both cases, the corrections will likely be over within the next week--at most.  Notably, the euro will probably not move much further down from here, implying that most of the dollar damage will be done in the next couple of days.

To contrast, gold is overbought on the daily, weekly, and monthly charts--implying that a substantial correction is ahead.  Given that this is a seasonally strong period for gold and the dollar is not oversold, we do not believe that gold will face a large correction until both the dollar is substantially oversold and the seasonally strong period for gold is over.  That will likely occur when the USDX is in the 70-72 range, at some point at the end of Q1/2010 or early Q2/2010.

So, what's the likely damage to gold during this correction, and how long will it last?

First, now that gold and the euro have "caught up" to one another and both are correcting, we believe this correction will be short term (next couple of weeks, at most) and will largely end when both the euro and yen are done.  For the dollar, it is likely that most of the rally will be done today with more possible "sideways movement" as the yen finishes its correction over the next week or so.  The implication is that most of gold's correction will likely happen today as well, with the potential to sell off more since the run thus far has been incredibly strong.

We overlayed the Fibonacci retracement lines from the point of this rally's breakout over the support lines we drew Wednesday to see where the likely support points are to watch.  If the dollar rally ends today, and it may, we may see the lows already at the 1195 area.  In that case, gold will remain dangerously overbought.  We would not add new positions until a more substantial correction occurs, though we would continue to hold our existing positions.

The more preferable target is around the 1130-1135 area.  Gold has found buying there several times already, including during the massive intraday sell-off last Friday (when it touched 1138).  1131 is a key Fibonacci retracement point.  All in all, that's a likely accumulation point given that it would not take too long (a week or less) to pull back to that region.  The timing works well with the anticipated pull back in the yen.

The 50% retracement level occurs near the 1100 level, which is where we originally anticipated the first sell off.  This would move gold, in the short term, to oversold and would a prime buying point at this juncture.

Finally, our old friend 1070 is also both a support point and a key retracement point.  That would gold if we could get such a pull back at this stage--pun intended.


 To each according to his own needs and risk tolerance, but here's how we'd play it.  We'd accumulate physical at 1070 and "paper gold" for trading purposes at higher levels.  Our longer term goal is to accumulate as much physical gold as possible with a low to zero cost basis.  The way we get there is to trade the intermediate term pull backs and accumulate when gold is strongly oversold.  That opportunity will likely come in the spring, but on the odd chance that we see a buying opportunity at less than 1100, we'd take it.

An important note.  If the dollar breaks its 50 dma, we'd hold off on buying anything until it appears that it is rolling over again.  The dollar rules it all, so there is not buying without a confirmation of a lower dollar move through a bearish pattern or a failed attempt at breaking resistance.  Again, we doubt that is in the cards until next year, but anything can happen.

We'll flash a buying signal here if the gold correction moves below the 1190 mark--enough to take a position in either paper or physical gold.

Enjoy the weekend!

Read more...

Tuesday, December 1, 2009

"Big Picture" Market Update - Global Health Update

It never fails that the most interesting news occurs when the masses are paying the least amount of attention to a story.  Since the US Thanksgiving holiday last week, we've seen Climategate break just days before the Copenhagen discussions where various global leaders will determine how much wealth will be bilked from the masses to keep them in perpetual servitude.  Dubai World, a government-sponsored construction company, is essentially bankrupt and won't be backed by its government owner, potentially leading to a default which may trigger a new round of credit issues if neighbor Abu Dhabi doesn't pony up oil money to bail it out.  Ahh, what is the price of keeping a high oil price these days?  This incident, of course, has caused considerable consternation in global markets, led to a very short term dollar rally and gold sell-off, and reminded the world what chain reactions may occur when sovereign entities default.  As quickly as it occurred, it retreated, however, and the euro finally convincingly broke out against the dollar and moved it on toward our key target levels.  Questions now arise about the solvency of the UK, shortly after the Iran-Britain-Sailboat-gate affair.  Australia continues to be the only westernized country with any sense as it raised its key rates, but behind the hawkish stance was a dovish posture.  Meanwhile, the quiet, but all important battle against the financial manipulators of the world continues...


There is very little real honesty left in the world these days....

What are we to make of this morass of information?  First and foremost, note that all dangerous news is set to be released (to the extent possible) when the fewest number of people are likely to be paying attention.  This next month may well be the most information-packed period in the last year as we enter an important holiday season where most of the Middle Eastern and Western world will be honoring various holidays.  It should get interesting.

Second, it is of critical importance to note that politics and fundamentals can trump trends.  Oil spiked, dollars spiked, and gold dropped--all significantly in very short time periods.  However, none of these situations can be sustained as any news-based information can only alter the trend in the short term, but not in the long term.

Third, this last week should be seen as a stark reminder that the world is really not stable right now, and frankly, things are starting to pull apart.  Since the spring season, generally markets have calmed down, but as the reality that all's not well sinks in, its time to start looking at the big picture again to get our bearings.

Let's take a look at the fundamentals, but from a technical perspective, to get a feel for the landscape.

First and foremost, our primary concern is another crash-like scenario where the US dollar rises dramatically, credit locks up, bonds start defaulting, and the markets dive.  In order to examine this, we need to look at credit-sensitive market indicators.

The following chart is the 5 year chart of the Treasury-Eurodollar (TED) spread.  Note that although we have recently "bottomed" (red circle on the right) and appear to be rising, we are still far away from the concern levels that occur when the TED rises above 1.00 (or 100, on this chart).  We are still well within the normal range from a five year perspective.  A spike above the .60 (60) level or so (as highlighted on the chart) would be a potential warning, and a spike above 1.00 (100) is definitely a sign of impending problems, though the lead time may be months out.  As of now, there are no concerns from the TED spread perspective.


Corporate and junk bonds continue to do well, though they are are not nearly as strong as they were several months ago.  Though the risk does not appear to be immediate, these are signs of a flattening rally.  In particular, before we could have another credit crisis episode, we'd have to see junk bonds start to break down.  So far, this has not occurred, but we are not looking nearly as bullish as we were a few months ago.

Note that in the first two charts, which are ETFs that mirror the junk bond sector, both the curves are flattening out and buying has continually been found near the 50 day moving average.  A sustained breakdown below the 50 dma should be considered a warning that there are credit problems in the junk bond market--one of the signs that forecast the last credit crisis.


The final bond chart is for slightly more conservative corporate bonds.  Note that it broke its primary trendline in October, but it has begun building on that base.  Again, we look to stay above the new trendline, which is closely running with the 50 day moving average.


The US 10-year to 2-year Treasury yield curve is not as valuable.  Given all of the quantitative easing going on by the Fed and the primary dealers, this chart is subject to incredible distortion.  Nonetheless, as the curve rises, it should be taken as a possible forecaster of problems.

There are two charts.  The first is a 3 year picture vs. the S&P.  It is clear that a substantial rise in the curve forecast the upcoming credit problems.  The second picture is a 20 year perspective of the same phenomenon.  Often, this indicator is used to forecast events standalone.  It is our belief that this rising curve must also be supported by a rising TED spread, a rising gold/silver ratio, and falling junk/corporate bonds to be of significance.


Speaking of the gold/silver ratio, here is a 3 year chart of it, before and after the credit crisis.
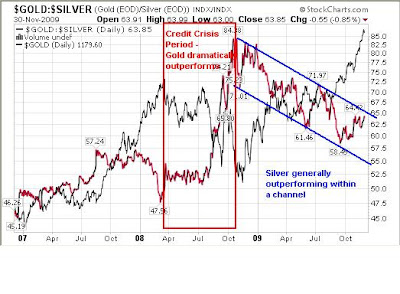


While both metals are monetary in nature, gold has always been considered money everywhere in the world, while silver has sometimes been considered money all over the world.  In addition, silver has a strong industrial component in automotive, film, and other applications.  The net result is that gold is always a safe haven for the big money, but a portion of the silver market can get sold off if the economy performs poorly.  You can see that going into the credit crisis, the gold/silver ratio was flat for a few months until the deleveraging forced a liquidation of assets.  As assets were being sold off and central banks began debasing their currencies, gold became a safe haven while silver was liquidated.  The end result was a rising gold/silver ratio that began when the commodity markets were devastated last July.  Since March, when the US dollar turned, markets have gone up, gold has gone up, but silver has generally been outperforming.  The big trend is for a lower gold/silver ratio, but there are times when gold outperforms within that general downtrend and then hands off the leadership to silver.  From the chart, you can see that as the gold/silver ratio hits around 65, we should see silver begin to outperform.  We're getting close to that period now.

For a wider perspective, here is the gold/silver ratio for the last decade of the precious metals bull market.


Again, though both gold and silver bottomed in 2001 and have generally been trending upward, the gold/silver ratio changes over time.  Initially, after the dot com bust and the 9/11/2001 attacks, gold was the leader as a safe haven.  In 2003, once the liquidity entered the markets and started the credit boom, silver was the leader.  In 2007, as a forecaster for both the equity market crash of October 2007 and the credit crisis of 2008, the gold/silver ratio rose (dramatically during the credit crisis).  Since that ended, the trend has yet again changed.

We would consider a break out of the trend channel to the upside, especially with a rise in the TED spread above 60, a rising 10 year/2 year Treasury curve, a breakdown in junk and corporate bonds, and a stable or rising dollar to mean that we're in for the next round of credit problems.

Speaking of the dollar...

Since we cover the long term dollar story regularly, let's take a look at the last few months.  Notably, the euro had not been able to break 1.50 against the dollar, leading to the dollar trading sideways around 75.  While that was predictable, we believed that the gold price would take that opportunity to correct.  It did not.  Instead, gold has continued to run up while the euro broke out.


Take note of the last three trading days on the dollar chart.  As we stated to start with, the interesting incidents take place during down periods.  Somehow, we doubt this is simply coincidence.  On Friday last week, the dollar made a strong intraday fight up as the Dubai story broke and gold moved down strongly.  The strength was short lived, however, as the dollar was taken back down below the key support level yesterday.  It failed to gain ground.

With 75 now acting as resistance for the dollar, we believe we're headed now for the 73 area, per our bearish breakout update last week.  The implication, of course, is that a very overbought gold market should continue to perform well.  In fact, the euro and gold have "caught up to one another," and the correlation amongst gold, the dollar, and the euro.


Gold continues to be a frightening and intriguing story.  By all technical indications, it is overbought.  However, with the dollar hanging around the 75 level for as long as it did, the dollar still has downside room.  When the dollar is oversold on daily, weekly, and monthly charts (which it is not--yet) at the same time that gold is overbought on the same charts (which has only occurred three times in the last 10 years), then the gold correction and dollar rally are substantial.  We believe we will see this around the 1300 level in the spring, but given the recent strength in gold, we may have to revise the gold target higher before a correction.  Unless the dollar enters the dustbin of history this spring, the rally will likely be substantial and gold will likely consolidate 25% or more.  Our upcoming gold report will explain more in detail.
 
In the short term, with the euro breakout, gold will likely continue to rally, though we are at the 1200 level which *may* provide a minor consolidation.  As of this writing, gold has broken above 1200, but has not held the gains.  Although we may finally see some form of consolidation, gold continues to surprise.  We're leery to add substantial new positions here without substantial correction.  The first support level will be around 1135-1140 now as gold has seen buying in that region several times.  After that is 1070.  If the correction is major (and we do NOT believe it will be--yet), we will see support at 1025.


We've recommended it before, but it may be better to buy paper gold here--assuming you already have a stash of physical gold.  Given that the odds are increasingly favoring a major consolidation in the 6 months or so ahead, profits can be taken and put into physical gold after the next consolidation.  The risk, however, is that paper gold is not real gold and most of the ETFs, we believe, are major frauds waiting to happen.  There is also a risk that the dollar could simply "give way" and crash, and in that environment, no paper gold will save you.  Please, protect yourselves first before speculating...

Another possibility is that we'll see gold have a minor correction here while silver begins to run ahead.  We are, after all, near that 65 level in the gold/silver ratio, and if we are not repeating a credit crisis (no strong evidence that says we are), then silver should begin to outperform soon.

Thus far, we have looked at the major credit market issues.  There is nothing on the horizon technically that is forecasting a global credit crisis--quite the opposite in fact.  Instead of a lack of liquidity, there is excess.  Gold has, in fact, been forecasting a dollar dive.  Central banks' hands are tied because they cannot raise rates and remove liquidity (Australia is trying, but we believe that their attempts are near an end) without wrecking credit markets.  At the same time, individuals are largely not credit worthy borrowers.  The liquidity is building up in the system, and the only release valves are the currencies.  See "gold" for more details...

Perhaps that liquidity will be of the "good inflation" variety?  Perhaps it will spur spending some way or another?

We don't think so.  That liquidity is going toward speculation.  When this bubble pops, it's over...


Dr. Copper continues its climb from the lows last December.  It has been hugging the lower end of its trading range, however.  Watch for a breakdown in the months ahead.


The Baltic Dry Index, while improved from its lows last November, is less than halfway to its former highs.  In short, global trade is not what it was, and has recently begun declining again.


Crude oil's move from last December's lows has started to fall below its trendline from that point.  It remains near key support levels.  Frankly, it looks a bit weak here.  Given the tensions in the Middle East, notably with Iran, it can spike at any time.  But left to its own devices, it seems to be stalling.


These global health indicators seem to be pointing to the global rally running out of steam.  This coincides nicely without our Q1/2010 forecast of the markets beginning to trade more on fundamentals.  The currencies continue to race to the bottom, with the pound and the dollar fighting for the lead dead dog.  The next few months will be telling.

We are currently holding existing investments without taking any new positions. It seems a correction is due, though this is not of the "credit crisis" variety.  If anything, the world is running out of people to bid up asset prices except in the gold market...

More stock market, gold, and energy market updates this week.  Until then...

Read more...

Wednesday, November 25, 2009

November 25 Dollar and Gold Report

Well, it appears gold is going to continue running since the euro broke out definitively above the 1.50 level.  Given the relationship between gold and the dollar for the last 10 years, either the dollar's really about to break down or gold is frothy.  We believe it's the latter, still.  This type of situation where gold has run up so dramatically versus the dollar has only occurred twice in the past 10 years.  Both times, gold ran longer than anticipated and corrected more strongly than anticipated when it finally did correct.  What to know more?  Email us and request a copy of our upcoming gold analysis.  It's free, but because of that price, it has slipped from our goal of publishing it today until sometime near the end of next week due to other priorities.  There is no free lunch....

US Dollar, the Euro, and Gold
The dollar is at an interesting crossroads.  Again, gold is either frothy, or forecasting a big downward dollar move. 

Below is a chart of gold versus the dollar and the euro since 1995:


The tighter correlation between the euro and gold has been present since 2006, with the euro outperforming at times and gold outperforming at times.  In general, gold is (and should be) generally outperforming all currencies.

Here's a closeup of the last 6 months.


Note that since November, the euro (in gold color), and the dollar (in black) have basically been moving sideways while gold (in red) has run up strongly.  Since these breakdowns in correlation do not last long, either the gold price is too high and a consolidation is needed, or the currencies are behind the curve with the dollar needing to break down and the euro needing to go on a run.  The euro had been leading gold for some time, but at this stage, gold has closed the gap and we should be seeing tighter correlation again.  We'll see for sure soon.

Let's look at a bullish and bearish case (short term) for the dollar:


The bullish technical case is a right triangle that would take the dollar up to the 77 level or so, breaking the 50 day moving average.  That would be a red flag were it to occur as it would also likely take the RSI above 50, indicating a bullish dollar move.  This has happened before, and when it happens while gold is overbought, every time a large correction occurs.  The slow stochastic indicates that the dollar should rise, but note that we may be crossing over into bearish territory (if the black line turns down and crosses the red line, then it will imply a bearish trend).  Meanwhile, the RSI is below 50 and has opportunity to move down further, but you can see a bullish trendline (in red) showing a series of higher lows.  In summary, a bullish case for the dollar here is fairly solid (a relief rally, if you will), except for that little euro problem in the index...


As we've mentioned before, there was a bullish and bearish possibility for the euro. It appears to have broken out in a bullish pattern based on the above chart.  The implication is that we favor a bearish dollar case right now.  Let's look at that possibility specifically.


In this case, there is another pennant (flag) formation in the dollar charts with a downside target of 73, which is getting very close to our target range near 72.  Watch the RSI for a break below the trendline as confirmation of a breakdown in this pattern.

Meanwhile, gold itself continues in a relentless bull run.


Without confirmation from the dollar, this appears to be a little euphoric, and approaching parabolic.  Gold is overbought on all indicators.  This chart, part of our upcoming report, should be of interest.  Here's a preview...


This chart is a few days old, but note that it depicts the monthly gold price for the last 10 years and the impact when the RSI moves into overbought on the monthly charts.  In every case, the sell-off was substantial.  The "lightest" sell-off was 17%.  The "heaviest" sell-off was 35%.  Factors influencing the magnitude of the sell-off: seasonality, length and depth of the run while overbought, and the state the dollar.

Here's the last 2.5 years of gold on the weekly charts, with corresponding peaks and lows.


And on the monthly, same period.


What does this mean?  First, it means that gold goes through euphoric periods like everything else, and when it does, it corrects back to the mean.  Ideally, we'll see a 5-10% correction in gold soon.  That would be very healthy for the gold market.  If it continues at this pace, we will see our 1300 target and then get a big correction.  Although this is what we already forecast would happen, we'd rather see a more sustainable move by seeing run ups, consolidations, and then further run-ups.  Since the lack of correction at the 1100 level, gold has gotten a bit euphoric--either that, or currencies are in trouble this holiday season.  We believe it's a bit premature for that, though that time may well come (which is why you need to own physical gold...).

It's a short week with a lot of travel, so reporting will be light this week.  Watch the currency markets for clues as to what's coming up.  Equities remain in a consolidation phase which will likely only be sideways trading as long as the dollar remains weak.  Let's hope we get a reasonable pull back in gold before it runs its entire seasonal bullish period in a parabolic state.  That's not healthy for its sustainable price activity.


Read more...

Friday, November 20, 2009

A Look at the Euro and Gold

While we focus on the USDX for most moves, which is the truest indicator of asset price direction over the last 10 years or so, the euro is the largest component of the USDX, and thus, the most important single currency to watch to determine the USDX direction.

Perspective is everything.  Here's a quick look at the euro over the last 5 years compared to gold.


Note that the direction is well correlated, with gold outperforming or underperforming in large intervals.  Since October, 2008, gold has been a bit behind the curve because of the forced deleveraging episode that occurred and created the gold buying opportunity of a lifetime.  Since this summer, gold has been gaining ground, as one would expect to see in a gold bull market.

Let's get a little more detail with just the last 6 months of movements.


You can see a very strong correlation with the various up and down movements.  If we consider the euro the constant (which isn't true, but it makes visualizing easier), then we can see that gold has generally been gaining ground since the summer, notably the end of June.  Nonetheless, with every euro upswing, gold rises, and vice versa--only the magnitude of the rise or fall changes.

Now, note the month of November, circled.  The correlation is not strong at all.  We believed we'd see a reasonable consolidation in gold given that we expected the euro to be indecisive, leading to a generally sideways movement in the USDX.  We got the latter, but gold has had a mind of its own as of late.  As we discussed Wednesday, we doubt that the correlation is going away between the USDX and the gold price (though it may be! we have to consider the possibility), so either the euro is due for a big breakout that will allow the USDX to fall, or gold is ahead of itself right here.

Gold has been consolidating since our call on the top on Wednesday.  We've been watching the 1 minute EURUSD charts and the spot gold price, however, and for every minor rise the euro takes, gold rallies strongly.  For every minor dip the euro takes, gold loses very little.  This is seasonal strength and leads us to believe that we will probably not see less than 1070 on the gold price, and it's likely we will not see a dip at all below 1100.

Thus the big question is "what is the euro (relative to the US dollar) going to do next?"

Here are a few things we're watching.

We showed the following chart on Wednesday.  There is a clear up channel for the euro, with strong resistance in the 150 region (150.50 to be exact).  The resistance line (red) and the lower channel up trend line are forming a right triangle.  The euro, at some point, should break to the upside above 150.50.  That will take the USDX down and gold up.  It will push the USDX toward 72 very quickly (and probably put a couple hundred dollars on the gold price).  There's also a chance, however, that the euro breaks below the bottom channel line, around 148.  If we get a close below that level, we'd expect to see a big dollar rally.  We don't think that will happen, so the bullish euro/dollar case is for the euro to break out in the next few days.


There is a potentially bearish case, though.


Conceivably, we could be looking at a head and shoulders top for the euro, with the neckline around 147.50 and a downside target of AT LEAST 142 (1.42).  That would likely set off a larger dollar rally and decline in gold price.  We doubt that this is the scenario at hand given that gold is seasonally strong now, the dollar is being used as a carry trade currency, and there's still more technical downside in the dollar before we have an oversold condition.  But anything's possible...

So, let's simplify this so that we have some points around which to make decisions.

The clear gold bullish case will be for a bullish euro.  The obvious point for trading will be for gold to break out when the euro breaks out above 150.5.  But, if you're looking to accumulate gold, we'd want to anticipate an up move.  So, look for the euro to touch 148 in the next few days and bounce.  If it touches that level and turns upward, gold's probably as cheap as it will get for now.  If it doesn't turn down further before it breaks out, we'd buy the breakout.  For those that don't have enough physical gold in their possession, incrementally buying beginning right here is probably the safest bet--moves in the euro and gold may happen very quickly, and gold is so bullish right now that there's no guarantee we'll see a lower price in the short term.

The bearish case is for a break below the lower trend channel, which is probably a warning that the head and shoulders will be activated.  If that's the case, it may be wise to take profits in more than gold since the dollar will likely rally and cause more assets to sell off.

We're buyers of gold on any bounce in the euro off of 148.  We'd cut any losses if the euro turned again and broke down below 147.50.  If the trend continued such that the USDX rose above its 50 dma, we'd probably short the stock market (needs more study there near that time, if it occurs).  We do not short gold in this environment EVER--there are too many unknowns and gold may go on sudden and monstrous rallies at any point with the reckless behavior of countries, central banks, and politicians.  Note that last year, even during the credit crisis, gold sold off and then began gaining ground even as other assets continued to decline.  Gold is, undoubtedly, the safest investment out there at this time.

Read more...

Thursday, November 19, 2009

Morning Commentary

It may be too early to call this "the pullback we've been waiting for," but since yesterday's call on a turn in the gold price, it appears that we *may* be getting it now.  Given the euro's potential to break out at any time, we're cautious about the target range that gold may sink to in the short term.  Ideally, we'll see 1070 again, but we may only see the 1100 mark.  We'll post a buy signal when we believe it's time to get back in.

Typically we don't do much commentary on news events simply because that's such a common occurrence.  We may be changing that with more commentary in the near future, key articles, and happenings.  We have a few coming up for the energy analysis we're going to have, but right now, here is one brought to our attention by an Australian reader that we thought was interesting and relevant to our dollar thesis.  Of particular note in this article is the second half of it where there is a technical discussion regarding the next US dollar rally.  It's a thesis and price level that is eerily similar, though not exact, to our own.  Enjoy.


Speculators and Chinese Firms Accumulating Australian Resource Companies and Commodities
By Dan Denning • November 19th, 2009

World class speculators and Chinese firms are accumulating Australian resource companies and commodities. This is the flip side to Australia being a net capital importer and the decline of the U.S. dollar. We rail about Aussie banks borrowing money abroad to invest in a housing bubble at home. But is there an opportunity in all this madness?


Of course there is. George Soros is picking up more shares of gold and potash producers. Mineweb reports that, "Billionaire investor George Soros' Soros Fund Management substantially raised its shares in PotashCorp as well as invested in gold ETFs during the third quarter. In Form 13F documents filed with the SEC, Soros Fund raised its PotashCorp from 1.98 million shares to 2.95 million shares with a fair market value of $266.4 million."


And while China and America bicker over currencies, Chinese firms are scrambling to buy real assets. And while Aussie banks source foreign borrowing to lend in local real estate, Aussie mining firms go begging for bits of capital that would bring world-class ore bodies (and key strategic resources) into production...by local producers and owners.


Take Moly Mines. It's aiming to operate a 10 million tonnes per annum copper and molybdenum mine at Spinifex Ridge in Western Australia. Prior to the credit crisis last year, things were going swimmingly. Molybdenum is a hardening agent used in steel-making. There aren't a lot of economic ore bodies in the world. Moly, according to the research we published in April of 2008 in Diggers and Drillers, had one of the most economic deposits.


But it all went off the rails with the credit crisis. The company couldn't secure the funding it needed to bring the project into production. And the share price fell. That made management amenable to any offer that would secure financing and rescue what was still, by all accounts, an immensely valuable and lucrative resource.


Yesterday, the Foreign Investment Review Board (FIRB) approved a $200 million investment in Moly by China's Sichuan Hanlong Group. It gives the Chinese group majority control in Moly and could see the development of the project at Spinifex Ridge begin in the middle of next year.


Good on the Chinese for finding a great project to invest in at a bargain price. The truth is, Australia has more good mineral and energy projects than the local capital markets can realistically fund (given the preference by the banks for investing in/spruikin property). BHP CEO Marius Kloppers made this point yesterday in a lecture to the Lowy Institute in Sydney.


Kloppers said there are 74 separate resource projects worth $80 billion the advanced stages of planning. Those projects need capital. "'Although clearly not simple," Kloppers said, "a part of the solution lies in continued foreign investment, meaning that both Australia and Australian companies need to be open to this kind of investment, despite its immediate and strategic implications."


What are those "immediate and strategic implications?" Well, up to now, existing Australian shareholders are being clobbered. Those who owned equity in these projects before the credit crunch have been diluted as the firms in question raised money with rights issues or institutional placements.


That's fair enough. Owning shares implies an assumption of risk. The stock market is not a savings account. But the other immediate implication is the transfer of majority ownership of these key projects to overseas owners (including the transfer of a big chunk of income from the assets).


This is what it is. And in most cases, it is not an issue of national security. The truth is, many of these projects won't get off the ground without foreign capital. They will create Australian jobs, export earnings, and share price gains for Australian investors. They will also secure key resources for foreign manufacturers.


There's no sense getting all lathered up about it. The status quo is a result of Australia's status as a net capital importer and the investment decisions made with the money Aussie banks have borrowed. The banks could have chosen to invest in Australian mines. But mining is a risky business.


Is it as risky as property? We don't think so. But the way the Australian property market is currently structured - with the government supporting prices directly through grants and indirectly through miserly land releases, and the banks channeling new lending into the market - it's a rigged game for the banks. Why wouldn't they invest in property? It's certainly in their interest.


Whether there is a national interest at stake in the mining industry is another question. You'd certainly think so, given how much government revenue is derived from royalties and exports. But most state governments and the Federal government seem happy with the current arrangement.


The large producers have an unassailable competitive position. And the smaller explorers and developers are left to their own devices to find capital for their projects. Hey...that's why they call it capitalism!


For investors with the patience to investigate the smaller fry, it's a great market. Our new editor of Diggers and Drillers, Alex Cowie, looks like an insomniac in a coffee shop when he comes to the office each morning. There are literally more good stories than he can possibly research.


The important point is that what might be a national problem - selling of mining projects to foreign investors - is an individual investor's opportunity. You always want to invest where you have an advantage. And as an Aussie resource investor looking at the mid and small caps, you DO have an advantage.


Sure, you may be investing alongside the Chinese, who may be getting a better deal. But there are dozens of smaller projects across the resource spectrum that - as long as the world does not plunge into a second great manufacturing depression - make compelling investment stories.


Murray got back to us with his U.S. dollar index chart. You may recall that the other day we published a chart of the dollar index showing that the short-term and long-term moving averages were in danger of crossing. Murray, a full time technical analyst, basically said our chart looked nice but didn't communicate any useful information to traders about when to enter or exit positions affected by the dollar's decline (or rise).


Murray sent over his chart with a note that begins, "The US dollar index is still in strong downtrend. My last update (to Slipstream readers) said that we needed to keep an eye on the 10 week/35 week Moving Average as the confirmation for any change of trend. Also we needed to see a close above around 81 to confirm a re-entry into the distribution between 78 and 89 formed over the last year."


"None of these indicators are close to being confirmed. So, from a long term perspective, you have to remain bearish the dollar although entry into any short positions is highly risky at this point. Have a look at the chart and you can see that the lowest dotted blue line comes in around a price level of 73 which is close to where we are now."


"The meaning of the lower dotted blue line is just that it is an area where a false break can occur. So even though the current price action doesn't look like it is related to the distribution between 78 and 89, it still could be so beware. You can see from the other ranges that I have shown in the chart that a break through the low of the range saw a move to around that lower blue dotted line and then saw a squeeze from there. The first one saw a move all the way back to the top of the range and the second one tried to re-enter its range but ultimately failed.


"The point being, if you had sold down at the lower dotted blue line on either occasion you would have ended up in a difficult position. The market usually looks terrible at those points, but all too often you will see a reversal there which will at least move back to the bottom of the range.


"In this case that would see a move back to 79ish. And from there a re-entry into the range could see a quick move to the point of control at 84 and on to the highs at 90. I think we will see the Dollar create a low somewhere between 67 and 74 and then we will see a big short squeeze to take out traders in what has become a very overcrowded trade.


"Don't get me wrong," he concludes. "I still think the US Dollar is toilet paper, but it doesn't mean it won't buck around like a wild bronco on its way to fiat currency heaven."


Yee haw!


Dan Denning
for The Daily Reckoning Australia

Read more...
join the mailing list
* indicates required

Dredd Recommended Reading

About This Blog

The Dredd Market Report is a guide targeting new investors with education and techniques for protecting and growing their wealth in turbulent times.

Nothing on this blog is a recommendation or solicitation to buy or sell securities, futures or other investments.

Debt Clock

  © Blogger templates The Professional Template by Ourblogtemplates.com 2008

Back to TOP