It never fails that the most interesting news occurs when the masses are paying the least amount of attention to a story. Since the US Thanksgiving holiday last week, we've seen
Climategate break just days before the
Copenhagen discussions where various global leaders will determine how much wealth will be bilked from the masses to keep them in perpetual servitude.
Dubai World, a government-sponsored construction company, is essentially bankrupt and won't be backed by its government owner, potentially leading to a default which may trigger a new round of credit issues if neighbor
Abu Dhabi doesn't pony up oil money to bail it out. Ahh, what is the price of keeping a high oil price these days? This incident, of course, has caused considerable consternation in global markets, led to a very short term dollar rally and gold sell-off, and reminded the world what chain reactions may occur
when sovereign entities default. As quickly as it occurred, it retreated, however, and the euro finally convincingly broke out against the dollar and moved it on toward our key target levels. Questions now arise about
the solvency of the UK, shortly after the
Iran-Britain-Sailboat-gate affair. Australia continues to be the only westernized country with any sense as it raised its key rates, but behind the hawkish stance was a dovish posture. Meanwhile, the quiet, but all important battle against the financial manipulators of the world continues...
There is very little real honesty left in the world these days....
What are we to make of this morass of information? First and foremost, note that all dangerous news is set to be released (to the extent possible) when the fewest number of people are likely to be paying attention. This next month may well be the most information-packed period in the last year as we enter an important holiday season where most of the Middle Eastern and Western world will be honoring various holidays. It should get interesting.
Second, it is of critical importance to note that politics and fundamentals can trump trends. Oil spiked, dollars spiked, and gold dropped--all significantly in very short time periods. However, none of these situations can be sustained as any news-based information can only alter the trend in the short term, but not in the long term.
Third, this last week should be seen as a stark reminder that the world is really not stable right now, and frankly, things are starting to pull apart. Since the spring season, generally markets have calmed down, but as the reality that all's not well sinks in, its time to start looking at the big picture again to get our bearings.
Let's take a look at the fundamentals, but from a technical perspective, to get a feel for the landscape.
First and foremost, our primary concern is another crash-like scenario where the US dollar rises dramatically, credit locks up, bonds start defaulting, and the markets dive. In order to examine this, we need to look at credit-sensitive market indicators.
The following chart is the 5 year chart of the Treasury-Eurodollar (TED) spread. Note that although we have recently "bottomed" (red circle on the right) and appear to be rising, we are still far away from the concern levels that occur when the TED rises above 1.00 (or 100, on this chart). We are still well within the normal range from a five year perspective. A spike above the .60 (60) level or so (as highlighted on the chart) would be a potential warning, and a spike above 1.00 (100) is definitely a sign of impending problems, though the lead time may be months out. As of now, there are no concerns from the TED spread perspective.

Corporate and junk bonds continue to do well, though they are are not nearly as strong as they were several months ago. Though the risk does not appear to be immediate, these are signs of a flattening rally. In particular, before we could have another credit crisis episode, we'd have to see junk bonds start to break down. So far, this has not occurred, but we are not looking nearly as bullish as we were a few months ago.
Note that in the first two charts, which are ETFs that mirror the junk bond sector, both the curves are flattening out and buying has continually been found near the 50 day moving average. A sustained breakdown below the 50 dma should be considered a warning that there are credit problems in the junk bond market--
one of the signs that forecast the last credit crisis.
The final bond chart is for slightly more conservative corporate bonds. Note that it broke its primary trendline in October, but it has begun building on that base. Again, we look to stay above the new trendline, which is closely running with the 50 day moving average.
The US 10-year to 2-year Treasury yield curve is not as valuable. Given all of the quantitative easing going on by the Fed and the primary dealers, this chart is subject to incredible distortion. Nonetheless, as the curve rises, it should be taken as a possible forecaster of problems.
There are two charts. The first is a 3 year picture vs. the S&P. It is clear that a substantial rise in the curve forecast the upcoming credit problems. The second picture is a 20 year perspective of the same phenomenon. Often, this indicator is used to forecast events standalone. It is our belief that this rising curve must also be supported by a rising TED spread, a rising gold/silver ratio, and falling junk/corporate bonds to be of significance.
Speaking of the gold/silver ratio, here is a 3 year chart of it, before and after the credit crisis.
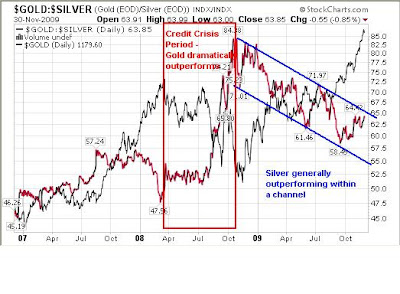
While both metals are monetary in nature, gold has always been considered money everywhere in the world, while silver has sometimes been considered money all over the world. In addition, silver has a strong industrial component in automotive, film, and other applications. The net result is that gold is always a safe haven for the big money, but a portion of the silver market can get sold off if the economy performs poorly. You can see that going into the credit crisis, the gold/silver ratio was flat for a few months until the deleveraging forced a liquidation of assets. As assets were being sold off and central banks began debasing their currencies, gold became a safe haven while silver was liquidated. The end result was a rising gold/silver ratio that began when the commodity markets were devastated last July. Since March, when the US dollar turned, markets have gone up, gold has gone up, but silver has generally been outperforming. The big trend is for a lower gold/silver ratio, but there are times when gold outperforms within that general downtrend and then hands off the leadership to silver. From the chart, you can see that as the gold/silver ratio hits around 65, we should see silver begin to outperform. We're getting close to that period now.
For a wider perspective, here is the gold/silver ratio for the last decade of the precious metals bull market.
Again, though both gold and silver bottomed in 2001 and have generally been trending upward, the gold/silver ratio changes over time. Initially, after the dot com bust and the 9/11/2001 attacks, gold was the leader as a safe haven. In 2003, once the liquidity entered the markets and started the credit boom, silver was the leader. In 2007, as a forecaster for both the equity market crash of October 2007 and the credit crisis of 2008, the gold/silver ratio rose (dramatically during the credit crisis). Since that ended, the trend has yet again changed.
We would consider a break out of the trend channel to the upside, especially with a rise in the TED spread above 60, a rising 10 year/2 year Treasury curve, a breakdown in junk and corporate bonds, and a stable or rising dollar to mean that we're in for the next round of credit problems.
Speaking of the dollar...
Since we cover the long term dollar story regularly, let's take a look at the last few months. Notably, the euro had not been able to break 1.50 against the dollar, leading to the dollar trading sideways around 75. While that was predictable, we believed that the gold price would take that opportunity to correct. It did not. Instead, gold has continued to run up while the euro broke out.
Take note of the last three trading days on the dollar chart. As we stated to start with, the interesting incidents take place during down periods. Somehow, we doubt this is simply coincidence. On Friday last week, the dollar made a strong intraday fight up as the Dubai story broke and gold moved down strongly. The strength was short lived, however, as the dollar was taken back down below the key support level yesterday. It failed to gain ground.
With 75 now acting as resistance for the dollar, we believe we're headed now for the 73 area, per our
bearish breakout update last week. The implication, of course, is that a very overbought gold market should continue to perform well. In fact, the euro and gold have "caught up to one another," and the correlation amongst gold, the dollar, and the euro.

Gold continues to be a frightening and intriguing story. By all technical indications, it is overbought. However, with the dollar hanging around the 75 level for as long as it did, the dollar still has downside room. When the dollar is oversold on daily, weekly, and monthly charts (which it is not--yet) at the same time that gold is overbought on the same charts (which has only occurred three times in the last 10 years), then the gold correction and dollar rally are substantial. We believe we will see this around the 1300 level in the spring, but given the recent strength in gold, we may have to revise the gold target higher before a correction. Unless the dollar enters the dustbin of history this spring, the rally will likely be substantial and gold will likely consolidate 25% or more. Our upcoming gold report will explain more in detail.
In the short term, with the euro breakout, gold will likely continue to rally, though we are at the 1200 level which *may* provide a minor consolidation. As of this writing, gold has broken above 1200, but has not held the gains. Although we may finally see some form of consolidation, gold continues to surprise. We're leery to add substantial new positions here without substantial correction. The first support level will be around 1135-1140 now as gold has seen buying in that region several times. After that is 1070. If the correction is major (and we do NOT believe it will be--yet), we will see support at 1025.

We've recommended it before, but it may be better to buy paper gold here--assuming you already have a stash of physical gold. Given that the odds are increasingly favoring a major consolidation in the 6 months or so ahead, profits can be taken and put into physical gold after the next consolidation. The risk, however, is that paper gold is not real gold and most of the ETFs, we believe, are major frauds waiting to happen. There is also a risk that the dollar could simply "give way" and crash, and in that environment, no paper gold will save you. Please, protect yourselves first before speculating...
Another possibility is that we'll see gold have a minor correction here while silver begins to run ahead. We are, after all, near that 65 level in the gold/silver ratio, and if we are not repeating a credit crisis (no strong evidence that says we are), then silver should begin to outperform soon.
Thus far, we have looked at the major credit market issues. There is nothing on the horizon technically that is forecasting a global credit crisis--quite the opposite in fact. Instead of a lack of liquidity, there is excess. Gold has, in fact, been forecasting a dollar dive. Central banks' hands are tied because they cannot raise rates and remove liquidity (Australia is trying, but we believe that their attempts are near an end) without wrecking credit markets. At the same time, individuals are largely not credit worthy borrowers. The liquidity is building up in the system, and the only release valves are the currencies. See "gold" for more details...
Perhaps that liquidity will be of the "good inflation" variety? Perhaps it will spur spending some way or another?
We don't think so. That liquidity is going toward speculation. When this bubble pops, it's over...
Dr. Copper continues its climb from the lows last December. It has been hugging the lower end of its trading range, however. Watch for a breakdown in the months ahead.
The Baltic Dry Index, while improved from its lows last November, is less than halfway to its former highs. In short, global trade is not what it was, and has recently begun declining again.
Crude oil's move from last December's lows has started to fall below its trendline from that point. It remains near key support levels. Frankly, it looks a bit weak here. Given the tensions in the Middle East, notably with Iran, it can spike at any time. But left to its own devices, it seems to be stalling.
These global health indicators seem to be pointing to the global rally running out of steam. This coincides nicely without our Q1/2010 forecast of the markets beginning to trade more on fundamentals. The currencies continue to race to the bottom, with the pound and the dollar fighting for the lead dead dog. The next few months will be telling.
We are currently holding existing investments without taking any new positions. It seems a correction is due, though this is not of the "credit crisis" variety. If anything, the world is running out of people to bid up asset prices except in the gold market...
More stock market, gold, and energy market updates this week. Until then...
Read more...


