join the mailing list
* indicates required

Tuesday, April 13, 2010

April 13, 2010 : Global Equity Picture

Before we begin, it appears that last night's call of a beginning of a (short lived) dollar rally and gold pullback was spot on.  Here's a secret.  In addition key currencies testing support and resistance levels (the euro, the dollar, and gold, among others), there was a turn in the dollar as forecasted by our proprietary short term cyclical model:


Though based on a Hilbert Transform, it has a few additional properties to better call tops, bottoms, and turns.  Note that in the chart, the most recent green line is generated mathematically, and began yesterday, before the rally.  This should serve as the dollar's bottom (as measured by the UUP ETF) for this rally.  We believe that it will probably run a half cycle as a top and turn lower.  If you follow the blog for the next few weeks, you'll get a better understanding of what we're referring to.  If the dollar breaks down below this point in the next few days, it will strongly suggest that the dollar has resumed a bear market trend.

Today, we'll focus on global equities.  Generally speaking, equities are largely overbought globally.  However, as many longer term readers may recall, the typical bear market rally lasts 22 months.  From March of 2009, that implies a January 2011 point when equities resume their bear markets.  We've been of the belief that equities would begin to turn lower at the end of Q2/2010, or perhaps early Q3.  At this stage, given how virtually everyone is expecting equities to roll over just any day now, we're inclined to give the benefit of the doubt to the rally.  The bears must prove themselves.  Thus far, they're falling short.  There are a few tried and true ways of defining the beginning of a bear market--we'll stick to those technicals and make the market prove its bearishness.  The trend is your friend--except when it bends, round the ends...

Let's cut to the chase on this one.  Global equities are overbought short to intermediate term.  They're due for a pullback.  However, the intermediate to longer term appears to be positive.  Note that since summer of 2009, we've had a call for a potential 1350 on the S&P 500.  Are stocks overvalued?  Yes.  Is a market valuation like that virtually crazy?  Yes.  But, as James Dines once said, (and I paraphrase) we should look at the charts and not think too much...

Global equities are closely tied together.  Take a look.   Only minor commentary is necessary.


The S&P 500 is overbought technically, but refuses to turn down.  Is the Fed buying futures?  Pumping money into the system near options expiration week?  Who cares?  Valuations are terrible and the market will likely correct strongly.  Near term, it's due for one.  Will it be a strong correction?  We'll only know after the fact.  At this stage, the S&P 500 is poised during the intermediate and longer term for a rise.

What about Asia's powerhouse, China?  Is it a bubble?  Will it crash?  Is it due to come down soon? 


The Shanghai Stock Exchange is in a symmetrical triangle, just waiting for a break one direction or the other.  Global markets depend on it breaking upward.  Will it?  Time will tell.  The trend is your friend...except when it bends, round the ends...


The Indian market is consolidating.  It's overbought.  Will it definitively break out?  Stay tuned..


The Aussie market's in much the same position...


Canada appears to be setting a more positive trajectory, with consistent bounces from the 50 dma.

Brazil is consolidating...


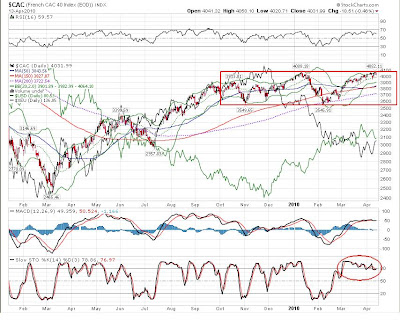
So is France, even in the wake of European debt issues...


Germany, with its export-driven economy, appears to want to continue to move up, though it may retreat to support soon.


In summary, global equity markets are technically overbought in general, but there is no technical indication that a serious breakdown is due any time soon.  Generally speaking, the rate of climb has slowed, but the positive trajectory continues.  It is very, very, very rare that stock crash without some form of technical warning.  Not even the 2007 global equity markets crashed without many very visible signs.  Though these markets are generally overbought, barring a black swan event, they are poised to correct and move higher.  And...if you're betting on black swans...the odds are not in your favor.

Send us an email if you're interested in something specific.  Without a growing audience, there's little interest in continuing a blog.  Send us an email if you'd like coverage of something specific. 

Read more...

Monday, April 12, 2010

April 12, 2010 - The Big Picture in Currencies

We really need to do a complete overhaul on things since we've been out a while.  In fact, we've been out designing some software to assist in market analysis.  Unfortunately, the project has taken on a life of its own, and as a result, we've neglected some blogging duties...

We'll kick things off by looking at currencies.

Currency Vs. Commodity Markets
One significant change that has occurred since the end of January is that the correlation among markets has broken down.  With the debt problems in Europe coming to light since last November, there has been an increase in non-USD denominated purchases of commodities, notably gold.  Here's a chart that shows the correlation, and (fairly) recent breakdown, more closely.


The above chart shows the S&P 500 (red) vs. crude oil (represented by West Texas Intermediate Crude in black) vs. gold (gold) vs. the US dollar (green).  We've drawn some straight lines through the major trend points simply to emphasize the general trends.  The correlation really began to break down in December as the dollar rallied due to euro weakness and fears of debt contagions, yet the S&P continued to move up.  Crude oil soon broke its correlation and finally, gold broke its correlation in February.  The effect is emphasized when you do a similar comparison between commodity currencies, notably the Australian dollar and the Canadian dollar, vs. the US dollar.


The above chart comparing currencies is significant.  The US is in no position to raise rates.  Europe is likely generally thrilled about a weaker euro (improves exports).  In the last 10 years, the euro has been perceived as the "anti-dollar."  The perception now appears to be shifting such that the dollar is perceived to be the "anti-euro."  In the past, traders and investors flocked to US dollars in emergencies.  When there was no emergency, they flocked to the euro, and to a lesser extent the commodity currencies like the Canadian dollar and the Australian dollar (also, the Brazilian real and the Norwegian krona).  Now, as the euro is increasingly deemed to not be a suitable dollar replacement, investors are not only flocking to dollars, but increasingly to commodities (and by proxy, commodity-based currencies).  This should be taken as a sign of inflation at this stage as this will force rising prices and a flock to assets.

In fact, aside from the euro, most all currencies have held their own against US dollars even as it rallied.


The Australian dollar has been trading in consolidation rectangle since September 2009.  It broke out yesterday, and though we may get one more round of consolidation here, it appears to be setting a base to move much higher. 

We wouldn't be surprised to see the Aussie dollar act like the Canadian dollar below, which already broke out during the US dollar's "rally."


Note that there was a breakout and a successful retest of the rectangle before it took off again.  At this stage, it will probably consolidate a bit again before breaking and holding the key 1:1 psychological barrier.

The Brazilian real is in such a formation.  Note that it had a false breakdown in February and has actually set up an inverse head and shoulders pattern.  When it breaks above the rectangle, it should run with strength.


It's not just the commodity currencies.  Though it's not as well formed, it's clear that the Indian rupee has also done very well during a "strong dollar" period. (Note that there may be a consolidation period beginning now based on the last candlestick).


You probably get the point.  Commodities have held their own, even with a US dollar rise.  This rise has not been due to dollar strength, but due to euro weakness:


Even the lowly euro appears to be putting in a bottom.  In fact, this is not far from our projected bottom that we wrote about months ago:


There was a false breakdown, but it was very, very close...

Does this mean the euro is at THE bottom?  It's difficult to say for certain, but we're certainly due for a reasonable rally soon--probably to at least the 1.42 mark.  Note that it's up against the 50 day moving average, which will likely serve as short term resistance.  Expect to see a pullback to 1.34 before trying to break out again.

For the US dollar, this is significant.


The dollar appears poised for a move down.  Just as we'd remarked time and time again that the 50 dma served as resistance for the dollar during the entire March 2009 - December 2009 period, it has served as support since then.  However, it has now broken below that level for the first time since December.

Given the move down in the dollar and up in the euro in the last few days, we wouldn't be surprised to see the dollar rise again in the very short term (next few days) before really resuming its downtrend.

It typically takes several months (charts show 4-6 months) after a major currency move for that currency to really top.  So, we anticipate that we may have a minor pullback in the euro and strength in the dollar over the next few days.  Over the next few weeks we expect to see a resumption of the downtrend in the dollar.  Over the next few months, we'll be putting in a trading range in the euro and dollar, much like can be seen above in the Australian and Canadian dollars.  Expect some choppy trading between the major currencies between the current high/lows and their 150-200 day moving averages, but the emerging markets and commodity currencies appear ripe for upward moves, with Canada leading the way.  It's going to be interesting.

So, where does this leave the ultimate currency in this mess, gold?


Gold appears just about ready to make a run towards its all time high, set in December.  Note that in the very short term, that is in the next few days (much like the euro), it will probably do a little base building.  It has had quite a run in the last 11 trading days, with 9 of the 11 up days.  It's due for a correction.

Intermediate term, it's becoming difficult to gauge what's going to happen with gold.  Seasonally, it should be strong for the next month, with a long consolidation period beginning in late May or early June and running into October.  We're inclined to believe that we'll see gold run and challenge its highs, then pull back into this range during the summer before running again this fall.  However, given the global situation with debt, money printing, and increasing global tensions, it's entirely possible gold will ignore its traditional seasonal pattern and run higher.

For perspective, let's take a look at currencies in gold terms before we wrap it up.

The US dollar is clearly at an important support level in gold terms.  There are fundamentally two key support levels marked on the chart for the dollar in gold terms before a resumption of the dollar bear market can be called.  The first will likely fall in the next few days to a week.

The euro is in a marked bear trend relative to gold and may stay there.  The strong resistance is marked with the red line.  Euro weakness has led to gold strength as Europeans wake to reality that Europe is at least as bad off as the US.  This chart will bear watching closely over the next 4 months or so.

There's a tug-of-war brewing between the Australian dollar and gold.  There's currently a trading range.  Will the Aussie dollar break up and knock the gold price down?  Sorry, Australia, but like the rest of the Westernized world, your currency is sinking, too.  For context, take a look at the last 4 years:

Note the consistent pattern of consolidation (in rectangles) and breaking to the downside.  Breakouts are "V" shaped and only last a few months. 

Canada.  Same problem.

In fact, ALL currencies are falling relative to gold.  Their rate of fall and timeframe are different, but they're all falling over time.

The big picture is that we in a global race to the bottom with respect to currencies.  Be prepared.

Finally, one last little chart.  The gold/silver ratio.
We've shown this one before.  It's a 20 year view.  When the channel is rising, gold is outperforming.  When the channel is falling, silver is outperforming.  In the background you can see the individual gold and silver prices.  If both are rising and the channel outlined in blue is falling, then silver is gaining ground faster than gold.

The gold/silver ratio is at the top of the trend channel that began in March, 2009.  The trend since then has generally been down, though it has spiked outside of the channel.  This is not atypical behavior.  Note that these trend channels go on for years.  As it stands, silver may be the outperformer for a while...

Next time we'll take a look at equity markets, which remain in bullish trends but are overdue for some consolidation.

If you like the blog, please drop us a note.  Tell us what you like, don't like, and would like to see more of.  Most of all, if you're getting valuable information here, do us a favor and tell your friends and family to take a peek.

Read more...
join the mailing list
* indicates required

Dredd Recommended Reading

About This Blog

The Dredd Market Report is a guide targeting new investors with education and techniques for protecting and growing their wealth in turbulent times.

Nothing on this blog is a recommendation or solicitation to buy or sell securities, futures or other investments.

Debt Clock

  © Blogger templates The Professional Template by Ourblogtemplates.com 2008

Back to TOP